PROCEDURES TO PERFORM
CATALYTIC CONVERTER EFFICENCY TESTS
ADVANCED CONVERTER TESTING
Converter Scan Tool Testing
As stated earlier in this manual, the traditional converter tests are not always accurate and much less so on newer vehicles. The best test is to simply watch for the same clues that the PCM does.
During the converter efficiency monitor, the PCM uses signals from the upstream and downstream oxygen sensors to determine if the converter has the ability to efficiently store and release Oxygen. The theory is that the converter should be capable of storing extra oxygen that comes in when the mixture is lean (low upstream HO²S voltage) and releasing it when the mixture is rich (high upstream HO²S voltage). So the upstream sensor voltage should switch with mixture changes, but the downstream sensor voltage should be fairly steady. The more the downstream sensor switches in relation to the upstream sensor, the less efficient the converter is at storing and releasing oxygen.
Index-Ratio & Switch-Ratio
For index-ratio and switch-ratio monitors, the converter is generally said to be degraded, if the rear-to-front switching ratio approaches about 70% (varies by application). Is it really? Well, this test only checks the oxygen storage capacity of the converter, but it has proven to be a very reliable indicator.
Oxygen Storage Capacity (OSC)
Many newer manufacturers use an Oxygen Storage Capacity (OSC) test, where the
PCM takes control of the mixture to measure the time-to-capacity for the converter.
The mixture is held rich to empty the converter of O², and then switched lean. The upstream HO²S will quickly switch lean, but the downstream HO²S will not switch until the converter has absorbed all of the O² it can and the extra exits the substrate.
Practical Application
The PCM uses the Oxygen sensors for both methods and you can, too. Comparing the switch rates on a Scan Tool or Lab Scope works for most applications but results can be vague. Therefore, you should also be well practiced at performing the OSC test. It requires the same Scan Tool or Lab Scope connections, in addition to tools for controlling the mixture.
Switch-Ratio Scan Tool Test
Test Procedure - Run the engine at 2,000 rpm for 2 minutes and then monitor the upstream and downstream HO²S signals. You can do this with a Scan Tool or a Lab Scope. For each 10 upstream sensor signal switches the downstream sensor signal should switch less than 7 times.
Test Example - In the example the downstream sensors are clearly cycling much less frequently than the upstream sensors, so this converter is in good condition (as far as the monitor can determine). The Bank 1 downstream sensor switches 7 times during 31 upstream sensor switches, which is about 23% (7 divided by 31). The monitor runs for a period of time so that any momentary converter cooling or changes in driving conditions cannot cause a false code to set. In general, a converter efficiency fault is simply caused by a damaged converter, but you should also rule out lazy upstream oxygen sensors, exhaust leaks, and other faults that may cause the test to fail.
If this test fails, you need to verify the engine mechanical, breathing, fuel (including HO²S calibration and performance), ignition, exhaust system integrity and other conditions that could cause the converter to have the improper ratio of inputs.
Converter Efficiency Testing (EASE Scan Tool Example)
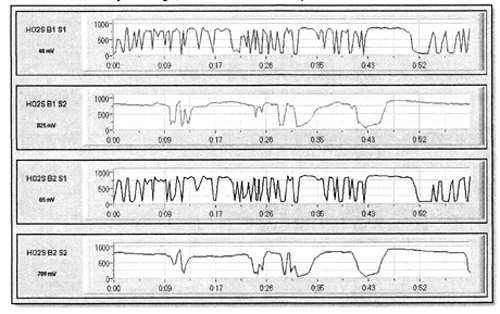
In the example below, the top 2 traces show the front (upstream) oxygen sensors and the bottom 2 traces show the rear (downstream) oxygen sensors. As you can see, the
B1S2 sensor is switching about 1/2 as often as the BlS1 sensor. While the exact ratio
(BlS2:BlS1) shown in the capture would not have set the code, you can see that the converter is clearly degraded. When comparing switches, remember that many of those shown for B1S2 are not counted by the PCM because the PCM needs to see switches across 450 mV to increment the counter.
The point of this example is to show that the converter efficiency isn't always so clear using this test. Therefore, your goal in comparing PIDs like this is to determine if the code is believable, and to use the results to choose the next step. As a side note, you
can also check the upstream sensors for range and performance during this test to
verify that the HO²S signals are not the root cause of the fault.
Note: If your Scan Tool won't graph data you're better off using a Lab Scope.
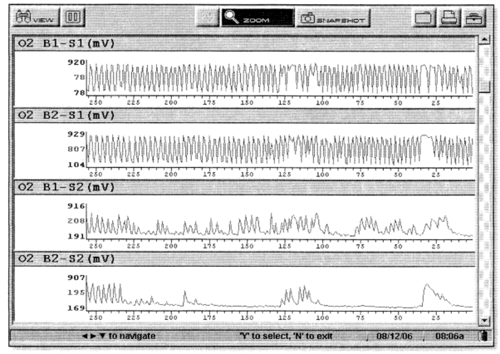
Failed Converter Test - Snap-On Modis Example
Switch-·Ratio Lab Scope Test
The first capture to the right shows one of the problems with this test. The first 10 seconds of the capture shows the upstream (Channel 1) and downstream (Channel 2) sensor signals at idle. Note that the downstream sensor is very stable and high, indicating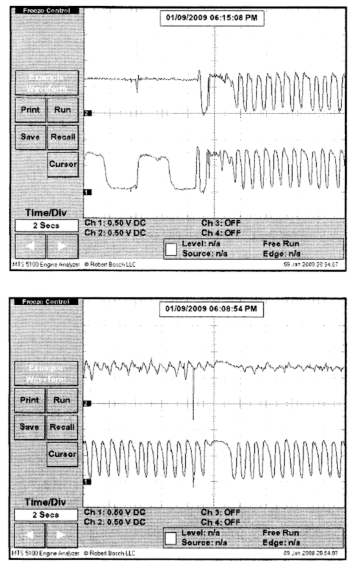
an efficient converter by any standard. However, as soon as the engine speed was raised to 2,000 rpm for the last 10 seconds of the capture, you can see that the switch ratio is 100%.
The second example shows the same sensors after a few minutes at cruise. The downstream signal evened out and even though there are some switches it's hard
to know if they count as switches as far as converter health is concerned.
In fact this converter was degraded, but these 'fuzzy' results illustrate the need to use the Oxygen Storage Capacity (OSC) Test described on the following pages. Of course if this test shows a clearly degraded converter, stop here. But if the results are at all unclear, the OSC test will be very helpful.
lf this test fails, you need to verify the engine mechanical, breathing, fuel (including HO²S calibration and performance), ignition, exhaust system integrity and other conditions that could cause the converter to have the improper ratio of inputs.
Oxygen Storage Capacity (OSC) Scan Tool Test
As described under Converter Scan Tool Testing, you can test the storage capacity of the converter using a Scan Tool or a Lab Scope. On newer vehicles, the data is so fast that you should use the Scan Tool, since the connections and setup are much simpler.
However, some older vehicle data refreshes so slowly that you can't see enough detail.
On those applications, directly connecting to the circuits for Lab Scope testing is your best option. After making the necessary connections, you need to decide how to control the mixture for the test:
- Use Propane in the intake to richen the mixture for a few seconds and then shut it off. The PCM will have been adapting for the rich condition with the Propane on so the lean switch should be dramatic when the Propane is turned off.
- Use any available Scan Tool bi-directional controls. Not all manufacturers have mixture controls available, but if they're there, use them.
When the mixture shifts rich, the O² content entering the converter is low. The chemicals in the substrate release any stored O² for use in oxidizing HC and CO. When extra oxygen (lean condition) is introduced to a good converter, the chemicals on the substrate grab the extra O² to store it for later use. After a few seconds, a good converter is "saturated" with O². The new O² entering the converter is simply passed through and will be sensed by the downstream sensor. So the amount of time between changes in O² content sensed at the front and back of the converter indicate how much O² the converter is able to grab onto. If there is over about a 2 second delay, the converter is considered good.
AFS Applications
While the Air/Fuel Sensor (AFS) has a fairly steady voltage during steady cruise conditions, it does have up to a 1.5 Volt range when the mixture is forced by driving conditions or the A/F Control Active Test. However the signal is inverted so you should expect the upstream and downstream signals to move in opposite directions.
Test Examples
The Scan Tool test is shown on the following page. For an example of the test run using a Lab Scope, refer to the PO42O Case #1 example under Case Studies at the end of this manual.
As previously stated, you can use the Scan Tool or Lab Scope for this test. However
you'll want to use the Lab Scope test if the Scan Tool data refresh rate is too slow on the application. And, you'll want to use the Scan Tool for most Air/Fuel Sensor (AFS) applications. The reason is that most AF Sensors have a steady voltage, and it's the current that cycles. The current is too low to accurately measure without some pretty invasive testing, so you're best off using the Scan Tool because the PCM calculates an equivalent voltage. This does not apply to all vehicles, but if you're familiar with both Scan Tool and Lab Scope techniques, you'll be successful.
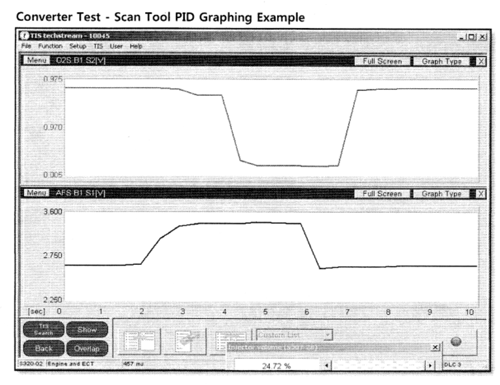
In the example below, the A/F Control Active test was used to manipulate the mixture.
The downstream sensor tool< almost 2 seconds to react to the lean command, but less than 1 second to react to the rich command. This converter has not set a code but has a clearly diminished oxygen storage capacity. Note that the AFS voltage range is opposite that of a conventional HO²S.
Alternate Converter Testing Tip
As a quick check watch the downstream sensor voltage at a steady cruise. If the converter is working it is using the stored oxygen to oxidize HC and CO into H²O and
CO2. Even with the reduction of NOX freeing up extra oxygen, the oxidation process should result in less free oxygen leaving the converter than entered it.
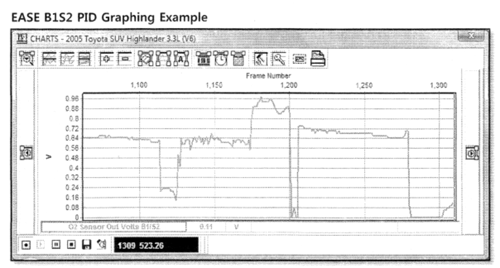
The result is that the downstream signal should show slightly rich. So if the downstream sensor voltage is showing a rich condition (around 600-700 mV), it's very likely that the converter is working. This test isn't 100% accurate and doesn't account for some fault conditions, but we've found it to be a very reliable indicator of converter health.
In the example below, the downstream sensor voltage uses almost the whole 0-1 Volt range during a test drive. However, you can clearly see that the average cruise value is about 600 mV, indicating that this converter is oxidizing.


 ImageBuilders